


The People Have Spoken … Well, Some of Them
Minority Mandate?

A key argument in favor of political democracy (or a republic, depending on one’s understanding of the actual makeup of the U.S. system) is that such a system represents the voice of the people. After all, each vote is equated to one person’s will for the direction of the country, state, or municipality.
Thus, most U.S. presidents have adopted a unitary vision in which the results of elections indicate exactly what “the country” wants, as if 340 million people have one goal and one view and simply coming together is the solution to the nation’s ills—as if that were even possible when politics is based on the idea of creating winners and losers.
For instance, after it became clear that he had won the 2020 election (subsequent controversies aside), Joe Biden stated the election result meant that he had a “mandate for action” from the American people. Similarly, in 2016, Mike Pence told the crowd at Donald Trump’s acceptance speech that “the American people have spoken, and the American people have elected their new champion.”
However, despite our politicians’ bravado and confidence in such results, the truth of the matter is a bit different and involves, in many cases, America’s largest political party.
Nefarious Numbers
To begin, many people associate democracy with majority rule, meaning that greater than 50% of a group chooses the outcome. And such associations are not without merit because the manner in which the media and others present election results epitomizes disingenuousness.
Take, for example, the results of the 2020 presidential election. According to the New York Times’s page dedicated to the election, Biden earned 51.3% of the popular vote to Trump’s 46.8%. Notice that the total is then 98.1%, which means 1.9% of the voters voted for someone else. So, what is misleading about that?
To answer that question, let’s delve into the actual totals, not percentages. Biden earned 81,284,666 votes versus Trump’s 74,224,319. That sums to 155,508,985 votes. According to the U.S. Elections Project, an actual total of 158,407,854 votes was received for president. This discrepancy is due to third-party and independent candidates who also received votes (the 1.9% mentioned above).
But the far more important number is this one: 239,924,038. That number is the voting-eligible population for the 2020 election. It is also the number that illuminates a bit of a different story about democracy, mandates, and what large numbers of the American people want.
One key fact derived from this number is the voting-eligible population turnout, sometimes referred to simply as “voter turnout.” For the 2020 election, the voter turnout rate was 66.6%. That number then leads us to the verity about voting in the United States: Fully one-third of the country decided not to vote. Put another way, 78,617,315 eligible voters simply abstained. Put even another way, nearly as many people opted to stay home as voted for the winner of the election.
Put even another way, nearly as many people opted to stay home as voted for the winner of the election.
Thus, in honest percentage terms, Biden won 33.9% of eligible voters, Trump won 30.9%, and couches at home won 32.8%. It is therefore accurate to state that 66.1% of eligible voters wanted a situation other than a Biden victory. I cannot recall ever being in a group in which only one-third of the people wanted something, so we all threw up our hands and said, “Well, that decides it. The group has spoken.” But that’s exactly what happens in most elections—time after time.
In fact, prior to 2020, we have to go all the way back to the heady days of the 1900 presidential election to find a time for which non-voters were not the largest single “voting” group. To be fair, from 1840 to 1900, turnout was 70% or better, but for over 120 years thereafter, that has hardly been the case.
In 2016, for example, Trump won with 46.1% of the popular vote, but only 60.1% of eligible voters turned out. Thus, the “American people” to whom Mike Pence referred represented only 27.7% of the eligible population. In the same phrasing I used above, that result means that fully 72.3% of eligible voters wanted a situation other than a Trump victory.
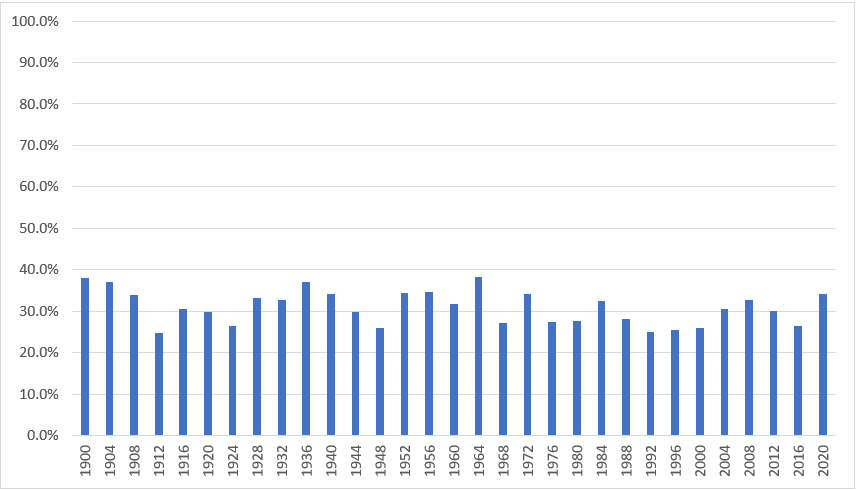
As Figure 1 below shows, since 1900, no winning candidate has won even 40% of the actual eligible voters, and, in many years, barely one-quarter of eligible voters chose the winning candidate (most recently, 1992, 1996, 2000, and 2016).
Are citizens really to believe that 25% or 30% of a group should choose one person to determine outcomes for everyone? Even the staunchest advocates of democracy and republics would, I think, second-guess such an idea.
Figure 1
Percentage of voting-eligible population won by the winning candidate, 1900–2020 U.S. presidential elections
Of course, such situations are common in democracies around the world, especially in many European countries with numerous political parties. For example, in the 2021 German federal election, six different parties garnered between 25.7% and 4.9% of the votes cast, and turnout in the election was an impressive 76.6%. However, that means that the “winning” party, the Social Democratic Party of Germany, truly won only 19.7% of the possible votes.
Yikes. That also means that the true winner of the German federal election should have been “none of the above” because non-voters represented 23.4% of those registered, far and away the largest “voting” group in that year.
Support or Antipathy?
However, even the numbers above do not elucidate the whole sordid story of each election because they fail to tell us why people vote for a particular candidate. If we truly want to know just how much a vote for Candidate A represents the “will of the people,” should we not know if the people even like Candidate A and his or her positions?
After all, it seems accurate to say that voting against someone rather than for someone else is hardly a ringing endorsement of the latter’s policies. If a parent tells a child that she can either mow the lawn or wash the dishes and she chooses to mow the lawn, then that parent’s later bragging about how much the child loves mowing the lawn seems a bit tone-deaf.
So, what do we know about people’s reasons for voting? Naturally, such numbers are more subjective than are actual voting numbers, but we have some idea via opinion polls how people feel and have felt about recent candidates here in the United States.
For example, according to a January 25, 2024, Reuters article,
Fifty-nine percent of respondents who said they planned to vote for Biden said they were motivated primarily by opposition to Trump, while Trump voters were more positive about their candidate and his policies, with just 39% describing their vote as one against Biden.
Likewise, according to Emory University political science professors Alan Abramowitz and Steven Webster, 87% of Americans with a party affiliation (stated or otherwise) who also disdain the opposing party will vote for their party’s candidates no matter what. Conversely, those with a party affiliation but more tolerance for the opposing party were about as likely to vote for the opposing candidate as for their party’s candidate.
The professors posit this finding means that people are generally voting against the other party, something they refer to as “negative partisanship.” In essence, such voting is more of a defensive maneuver that says less strongly “I want this person to lead me” than it does “I’d rather be hit by a city bus than be led by that person.”
As politics becomes a progressively important part of life for many people, whether through their perceptions and/or government’s growing reach, such findings may suggest that partisan rancor is only growing and thus that people’s votes increasingly reflect antipathy rather than amity.
If we set aside for a moment the inherent unreliability of opinion polls and academics’ theories, let us perform some quick math to complement that in the previous section. Let us assume for ease of calculations that in the 2024 election, Biden (if he survives staircases in the interim) and Trump (if he survives the legal system in the interim) each receive exactly 50% of the popular vote or 80 million votes each. Further, assume that 30% of eligible voters do not vote. Finally, we will use the numbers from the Reuters article and assume that 59% of Biden’s votes are actually against Trump and 39% of Trump’s votes are actually against Biden.
What do our calculations tell us about the “mandate to rule”? Biden would receive 50% of 70% of the eligible votes, 59% of which are not actually for Biden. Thus, people ostensibly voting for Biden would represent just 14% of eligible voters. Trump would not fare much better: 50% of the 70% of eligible votes, 39% of which are not actually for Trump. Thus, Trump supporters would represent just 21% of eligible voters.
To put those percentages into perspective, Biden theoretically would win the support of 32.8 million people (roughly the population of California) while Trump would win the support of 48.8 million (roughly the populations of Texas and New York). In a country of over 336 million people, are those numbers really indicative of anything other than the failure of a single political system to be able to represent large groups of people with very diverse beliefs, desires, and lifestyles? Our math experiment suggests only 14% and 21% of eligible voters may actually want that particular candidate to win rather than the other candidate to lose. It seems the will of the people is more accurately described as “No, thank you.”
A Comparison
Much of the reason for such enmity (or, at least, disenchantment) stems from the forced, limited options available to voters and the perceived and often very real and growing influence of politics in people’s daily lives. When we compare political voting to the “daily plebiscite” of the market, we can generally ascertain people’s preferences much more clearly and honestly. For example, it is unlikely that I purchase Lay’s potato chips simply because I feel it is incumbent upon me to stop the virus that is Ruffles potato chips from infiltrating any more of American society. It is equally unlikely that I will purchase some potato chips simply because I feel like I must choose a snack food or I deserve whatever happens to me because I did not voice my snack-food opinion (plus, maybe I’ll get a neat sticker that says, “I snacked today”).
Why is this? Because I and others have not allowed potato chip companies to rule our lives, they simply do not. I can do business with them or not. I can choose among a wider variety of options, or I can choose none of them. I feel no sense of duty to buy any of them, and Lay’s or Ruffles has no influence over my life if I choose to abstain. Truly, in the market, our votes are impactful and free because (1) companies will go out of business or change their practices if they do not provide value to enough people, and (2) we always have the option not to buy something and to be left alone if we choose to do so.
Perhaps these differences between the market and politics explain quite a bit about why people get excited about the products and services provided by those in the market while they need to be wheedled, cajoled, and browbeaten in many cases to even participate in politics every few years, and then, often, only to keep a mortal enemy from gaining more power over them.
Some claim markets are dog-eat-dog, but, when we unpack that idea even a bit, which of the above systems truly represents the “will of the people”?
I would have preferred the statistics to use the total number of REGISTERED voters instead of total eligible voters. The unregistered population already have chosen to live with any election outcome on any subject. Registered voters at least profess to care about the outcome - like local taxation and bond issues as well as state and national elections.
Great piece.
When people hear "democracy" they simply think "good." Their analysis extends no further than that.